Control valves are an essential component in many industrial processes, used to regulate the flow of fluids such as gases and liquids. Proper control valve sizing is crucial for maintaining precise control over the process parameters. Inaccurate valve sizing can result in issues such as cavitation, flashing, and reduced performance.
Control valve sizing calculation is crucial for maintaining efficient and reliable industrial processes. By following the proper sizing process and selecting the appropriate valve type, engineers and operators can ensure the optimal performance of their industrial processes.
Table of content:
Theory of control valve sizing
Commonly used terms for control valve sizing
Information required for sizing control valve calculation
Control valve sizing calculation
Theory of control valve sizing
Control valve sizing is the process of selecting the appropriate size of a control valve for a specific industrial process application. Control valves are used to regulate the flow of fluids such as gases and liquids, and proper sizing is essential for maintaining precise control over process parameters such as flow rate, pressure, and temperature.
The sizing process involves determining the process parameters, selecting the appropriate valve type, calculating the required valve coefficient (Cv), determining the valve size, and verifying valve performance. Proper sizing ensures that the valve can handle the maximum expected flow rate while maintaining the desired level of control, and can prevent issues such as cavitation, flashing, and reduced performance.
Control valve sizing can be represented by simple term Cv. Cv of control valve can be written as
Cv ∝ F√(ρ/∆P)
Where,
Cv is Valve flow coefficient
F is mass flowrate
ρ is specific gravity of fluid at inlet conditions
ΔP is pressure drop across the control valve
Above equation is valid for single phase and correction needs to be applied for two or multiple phases. The proportional constant is typical vendor correction factors and varies between 0.85 and 1.0. Some vendors apply various factors as viscosity correction, density correction, etc.
When sizing the control valve few things needs to be known such as flow variations, fluid variations, temperature variations, pressure drop variations.
Typical schematic of any control valve system is as follows
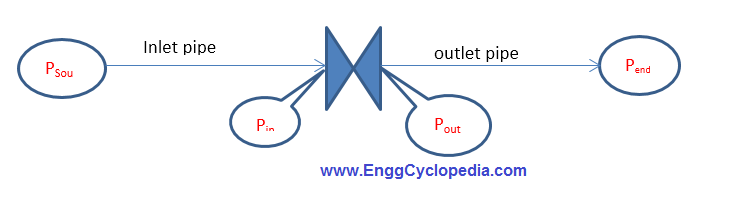
We should know following
Psou= Source pressure and elevations of liquid level
Inlet pipe (including lengths, material-roughness), fittings details (elbows, valves, tees, etc), elevations details (from source till inlet of control valves), etc.
Outlet pipe (including lengths, material-roughness), fittings details (elbows, valves, tees, etc), elevations details (from control valves to the end equipment), etc.
Pend = End or destination pressure
With these details, we can estimate the
- Pressure at the inlet of control valve, Pin i.e. difference between Psou and pressure drop in inlet pipe (including elevation). The pressure drop is termed as ΔPin
- Pressure at the outlet of control valve, Pout i.e. addition of Pend and pressure drop in outlet pipe (including elevation). The pressure drop is termed as ΔPout.
Above detail can be written as,
Psou-Pend = ΔPin+ΔPcv+ΔPout
Above equation is valid for system without any pressure increase (like with pump or compressor). The same can be written as
ΔPcv = Psou+ Pincr-Pend - ΔPin - ΔPout
Where, Pincr is the pressure increase in pump or compressor. Please use the performance curve to estimate the pressure increase when characteristic or performance curve is available.
Please note that, pressure drop in piping is function of flowrate. Discharge pressure (discharge head) in pump or compressor is also function of flowrate. If the flowrate increases, then pressure drop is higher in piping. Essentially it means that, for same source and end pressures, control valve typically get lesser pressure drop with increase in flowrate.
For proper of sizing of control valves all possible flowrate scenario and its pressure drop across (and effectively Cv) to be reviewed and proper characteristics can be selected. Ratio of maximum Cv i.e. Cvmax and minimum Cvmin determines rangeability of control valve.
Depending upon the requirement the valve characteristic can be selected. Usually control works when the operating Cv (Cvmax and Cvmin) is between 15% and 85% of selected Cv. The range of useful operations changes from operator to operator as well as vendor to vendor. Cv of 15% to 85% of rated Cv is approximate healthy range of control valve operations.
When sizing control valve, vendors or design engineers use Cvmax as 85% and select design Cv, it is termed as Cvrated. If the ratio of Cvmin and Cvrated is more than 15% then selected control valve will work for whole range of control valve. This represents the case linear characteristic of control valve.
Commonly used terms for control valve sizing
Flow Co-efficient of a Valve
The flow coefficient of a valve is a measure of its ability to allow fluid to flow through it. It is a standardized way of comparing the flow rates of different valves. The flow coefficient is typically expressed in Cv or Kv units.
- The Cv of a valve is defined as the quantity of water, at 60 °F, in US gal/min, that will flow through the valve at a specified travel with a pressure drop of 1 psi.
- The Kv of a valve is defined as the quantity of water in m3/h, at a temperature between 5 °C and 40 °C that will flow through the valve at a specified travel with a pressure drop of 1 bar.
- Kv = 0.856 Cv.
The flow coefficient of a valve can be used to determine the flow rate that can be achieved through the valve at a given pressure drop.
Cavitation
Cavitation is the formation and collapse of vapor bubbles in a liquid flowstream caused by changes in pressure and velocity. Cavitation occurs in liquid service when the pressure in the valve body falls below the vapour pressure of the liquid. The bubbles that are formed will implode immediately or shortly after leaving the valve, due to the downstream pressure of the control valve recovering to rise above the liquid vapour pressure.
Cavitation can be caused by a number of factors, including low pressure, high velocity, and improper valve design. Cavitation can cause a number of problems, including noise, vibration, erosion, and leaks. Control valves should be sized to the flow requirements of the system and should be installed in a way that minimizes the formation of vapor bubbles.
Choked Flow
Choked flow occurs when the fluid velocity at vena contracta reaches the speed of sound. Choked flow can occur for both incompressible and compressible fluids.
When choked flow occurs, the fluid velocity cannot increase any further, even if the pressure difference across the nozzle increases. This is because the speed of sound is the maximum possible velocity for a fluid.
Choked flow can have a number of negative effects on a system. For example, it can cause a significant increase in pressure drop across the nozzle. It can also cause the flow to become turbulent, which can lead to erosion and vibration.
Flashing
Occurs, for liquids only, when the pressure in the valve body falls below the liquid vapour pressure and when the bubbles thus formed remain as vapour in the fluid, owing to the fact that the downstream pressure of the control valve is at or below the liquid vapour pressure.
Control Valve Authority
Control Valve Authority is the ratio between the pressure drop across the control valve at a certain relative travel to the pressure drop across the control valve in its fully closed position.
Inherent equal percentage characteristic
Inherent equal percentage characteristic of a valve is a characteristic whereby equal increments of relative travel yield equal percentage changes of the relative flow coefficient.
Inherent linear characteristic
Inherent linear characteristic of a valve is a characteristic whereby equal increments of relative travel yield equal increments of relative flow coefficient.
Information required for sizing control valve calculation
Information required for sizing control valve is as follows:
- Inlet pressure all possible cases
- Outlet pressure (or pressure drop) all possible cases
- Inlet temperature all possible cases
- Mass Flowrate all possible cases
- Solids content and size
- Critical temperature and critical pressure
- Allowable shutoff differential pressure
- For liquid service
- Vapor pressure
- Density
- Viscosity
- Surface tension
- For gas service
- Molecular weight
- Compressibility factor at the inlet and outlet conditions
- Cp/Cv ratio
- Dew point temperature
- Multiphase service
| Gas Properties | Liquid Properties |
|---|---|
| Molecular weight | Vapor pressure |
| Compressibility factor at the inlet and outlet conditions | Density |
| Cp/Cv ratio | Viscosity |
| Dew point temperature | Surface tension |
- Expected valve characteristics
- Design pressure or pressure rating of connecting system
- Design Temperature
- Body size (connecting flange rating)
- Allowable noise level
- Actuator/Air/gas fail status
Control valve sizing calculation
Problem Statement
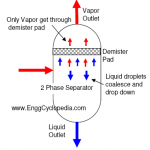
A level control valve is to be installed on an 8” oil line going from an oil water separator to an oil heater. The oil water separator operates at 3.5 barg and 250C. Inlet pressure requirement at the heater is 2.0 barg. Normal, minimum and maximum oil flowrates are 200m3/hr, 60m3/hr and 220 m3/hr respectively. Size a level control valve to determine the control valve flow coefficient or valve Cv.
Oil properties are –
Density at given conditions = 700 kg/m3
Viscosity at given conditions = 5 cP
Critical pressure = 60 bara
Vapor pressure = 1.5 bara
The details of the oil line are –
Line size 8”
Total length of the line = 50m
Heater inlet nozzle elevation – vessel outlet nozzle elevation = -4.0 m (heater is on the ground and vessel is elevated)
Fittings – 12 nos. of 900 elbows and 2 gate valves

Step 1
First step of solving this control valve sizing sample problem is to determine the line pressure drop resulting due to frictional losses from pipe and fittings plus elevational losses. Normally for this case, the level control valve would be located close to the separator vessel. Hence the pressure drop between vessel and the control valve has been neglected and inlet pressure to the control valve has been assumed to be the same as vessel outlet pressure.
Frictional losses from straight pipe alone can be easily calculated using EnggCyclopedia’s pipe pressure drop calculator for single phase flow as follows.
Mass flow of oil = 200 X 700 = 140000 kg/hr (Normal flow case)
Mass flow of oil = 60 X 700 = 42000 kg/hr (Minimum flow case)
Mass flow of oil = 220 X 700 = 164000 kg/hr (Maximum flow case)
As per EnggCyclopedia’s calculator, pressure drop in bar/km of straight pipe is reported here for the 3 cases,
For normal flow case,
pressure loss = 1.09 bar/km; frictional pressure drop in straight pipe = 0.05 X 1.09 = 0.0545 bar
For minimum flow case, pressure loss = 0.128 bar/km; frictional pressure drop in straight pipe = 0.05 X 0.128 = 0.0064 bar
For maximum flow case, pressure loss = 1.445 bar/km; frictional pressure drop in straight pipe = 0.05 X 1.445= 0.0723 bar
Fluid velocity expressed in m/s, for each flow case is also calculated at this time. This velocity will be later used for determination of pressure drop due to fittings.
For normal flow, velocity = 1.71 m/s
For minimum flow, velocity = 0.51 m/s
For maximum flow, velocity = 2.01 m/s
Elevational pressure loss for all three cases is the same and is equal to (density X gravitational acceleration X elevation change).
Hence for all the three cases pressure loss is = 700 X 9.8 X (-4.0) / 105 bar = -0.2744 bar.
Negative value indicates pressure gain instead of pressure loss due to drop in height.
To determine frictional pressure loss due to fittings, first the combined K-factor of fittings is calculated using EnggCyclopedia’s K-factor calculator.
For 12 nos. of 900 elbows and 2 gate valves, K factor = 5.64.
Pressure drop due to fittings is obtained by multiplying the K-factor by ρv2/2 for each case, where ‘v’ is the velocity in m/s. Velocity for each flow case is calculated in EnggCyclopedia’s pipe pressure drop calculator for single phase flow.
For normal flow case, fittings pressure drop = K X ρv2/2 = 5.64 X 700 X 1.712 / (2 X 10⁵) = 0.0577
For minimum flow case, fittings pressure drop = K X ρv2/2 = 5.64 X 700 X 0.512 / (2 X 10⁵) = 0.0051
For maximum flow case, fittings pressure drop = K X ρv2/2 = 5.64 X 700 X 2.012 / (2 X 10⁵) = 0.0798
Total pressure drop can be the calculated by adding the 3 components calculated independently for each case,
Line pressure drop for normal case = 0.0545 + 0.0577 – 0. 2744 = -0.1623 bar
Line pressure drop for normal case = -0.2629 bar
Line pressure drop for normal case = -0.1224 bar.
Note that, due to drop in height, the net pressure drop in the line has turned out to be negative.
Step 2
Next step for solving the control valve sizing sample problem is to determine the allowable pressure drop across the control valve for each of the three cases. It is calculated as,
Pressure drop across control valve = Vessel outlet pressure – Heater inlet pressure – line pressure drop
For normal flow, ΔP = 3.5 – 2 – (-0.1623) = 1.6622 bar
For normal flow, ΔP = 1.7623 bar
For normal flow, ΔP = 1.6224 bar
Step 3
The final step of solving this sample problem is to determine the control valve flow coefficient or valve Cv using EnggCyclopedia’s control valve sizing calculator. The inlet pressure to the valve is taken as vessel operating pressure since the valve is very close to the vessel. The outlet pressure is taken by considering the allowable pressure drop across the control valve. Following valve Cv values are calculated for the 3 cases.
Normal flow Case, Cv = 150.44
Minimum flow case, Cv = 44.31
Maximum flow case, Cv = 178.94
The chosen valve Cv is always higher than the maximum Cv requirement with a margin for valve opening. These valve Cv values are given to the control valve manufacturer along with corresponding flowrate values and subsequently a suitable valve with a higher valve Cv is chosen to be installed.