Scope of vibration Analysis
Vibration measurement and analysis is a main method of condition monitoring applicable to rotating machines in general.
The amount of vibration depends on:
- The exciting force.
- How close the frequency of this exciting force is to structural resonances or their multiples (harmonics).
- The restraints that pump structure imposes to vibration.
Vibration in a pump is usually at its lowest when operating at best efficiency point, and can double in amplitude, as flow is reduced to around 25% or BEP. This is an important consideration when taking routine measurements as a range of vibration levels may occur although the pump internal condition in unchanged.
All machines, including pumps, vibrate to some extent, but these questions often arise:
- How much vibration is excessive?
- If the vibration is excessive, what is its cause and how can it be solved?
- What else can vibration, even if not excessive, tell us about machine condition?
How is vibration measured and interpreted?
Vibration can be measured or expressed using three basic parameters: Displacement, Velocity, and Acceleration.
On most machines, vibration is usually present at frequencies other than the frequency corresponding to the speed of rotation (or synchronous, called here l x), making the time waveform more complex than a simple sine wave. Readout instruments perform the conversion for simple or complex vibration signals by electronic integration (from Acceleration to Velocity to Displacement). By the laws of physics, at low frequencies, a given vibration will have large Displacement and small Acceleration.
The opposite also applies at high frequencies where high Acceleration, low Displacement are expected. Across all frequencies, Velocity is reasonably constant- which is why it is the most commonly used parameter for most machine vibration.
Monitoring rolling element bearings
There are many methods of monitoring rolling element bearings and research is investigating into more such methods. Special instruments using the principles of Acoustic Emission (AE) are commonly applied. Various trade names used are Shock Pulse Monitoring, Spike Energy, Spectral Emitted Energy, PeakVue, Holroyd AE, Stress Wave Analysis.
Most of these techniques give single figure parameters and are sometimes included in instruments that also read overall vibration level. It is important with the special methods, to measure vibration via a direct metal-metal path. Sometimes this is difficult, such as on motor NDE bearings, so one must try and get the close as possible to this ideal.
As only complete bearings can be replaced, for practical purposes it is usually sufficient to know if a bearing is damaged in some way. However, knowing the frequencies and the fact that they are inevitably non-synchronous with rotating speed, can sometimes explain observed peaks in the vibration spectra from a machine.
What is the use of vibration monitoring in maintenance?
Routine readings are taken at suitable intervals. For most vibration monitoring, monthly is usual. For other monitoring, quarterly or even yearly is usual. Continuous monitoring may be appropriate for critical machinery.
Vibration monitoring is the best known and most publicized technique, and the most powerful for rotating machines such as pumps. Well-aligned and smoother running machines use less energy and in general also cost less to maintain, balancing is a common solution, temporary or permanent, to high vibration. Vibration instrumentation can also be used for balancing, but simpler methods are sometimes possible and acceptable.
Useful results can be obtained with low-cost, read-only instruments. But for large plants it is much more productive to use portable data collector/analyzers and computer processing systems. Several good systems are available, usually with diagnostic aid software. These continue to improve in capability.
Vibration standards are commonly included in specifications for rotating machinery. The site measurements taken for initial acceptance can be the start of routine measurements, and should also be part of post-maintenance quality checking.
What information shows on chart trends and use of vibration spectrum?
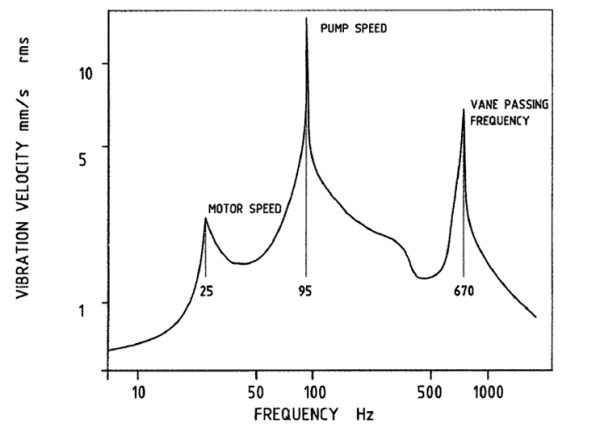
The signature up to 1000Hz from the vibration on a bearing of a multistage boiler feed pump is shown in following figure and was obtained with a manual analyzer with constant percentage bandwidth filters. The motor speed is 1480 r/min, stepped up through a gearbox to drive the pump at 5728 r/min. The effect of some motor unbalance is evident at about 25Hz. Pumps usually show quite strong vibration components at lx, (here 95Hz), and vane-passing frequency (number of blades on impeller x rotation speed), but this is not always regarded as of great concern. As the pump impellers here have 7 blades, 7x is 670Hz. The overall vibration exceeded 16 mm/s rms.
In this spectrum, the major component is 14.5 mm/s at 95 Hz, corresponding to the pump rotation speed. With this type of analyzer, the overall level is given by finding the square root of the sum of the squares of the individual components. The 95Hz component thus contributes [14.5 ÷ 16.3]2 or 80% of the overall vibration. Unbalance is the most likely cause, and here balancing of the pump solved the vibration problem.
Knowledge of the vibration frequency components provides more insights into the cause of vibration. For example: unbalance gives vibration at l x 3x). , sometimes with harmonics (2x, misalignment also gives vibration at lx, but usually 2x is dominant. Higher axial vibration is also an indicator of misalignment. The effects of misalignment are similar to those from unbalance.