Pump performance curves are important drawings produced by the pump manufacturer. Pump performance curves are primarily used to predict the variation of the differential head across the pump, as the flow is changed. But in addition variations of efficiency, power, NPSH required, etc, as the flow is changed, can also be represented on the pump performance curves by the manufacturer.
It is important to be able to read and understand the pump curves for the selection, testing, operation and maintenance of pumps.
Table of content:
Pump Performance Curve
Differential Head of Pumps
Pump Efficiency
NPSHR (Net Positive Suction Head Required)
How to read a pump curve
Examples of pump curves
Using pump curves in operation
Pump Performance Curve
Typically a pump performance curve will carry information about the following points. Pump curves typically include performance metrics based on pressure, flow, horsepower, impeller size, and Net Positive Suction Head Required (NPSHR).

Differential Head of Pumps
Centrifugal pump curves are useful because they show pump performance metrics based on a head (pressure) produced by the pump and water flow through the pump. Flow rates depend on pump speed, impeller diameter, and head.
What is head?
The head is the height to which a pump can raise water straight up. Water creates pressure or resistance, at predictable rates, so we can calculate head as the differential pressure that a pump has to overcome in order to raise the water. Common units are feet of head and pounds per square inch.
What is the total dynamic head?
While pump curves help you select the right pump for the job, you first have to know the total dynamic head for the application.
Total Dynamic Head (TDH) is the amount of head or pressure on the suction side of the pump (also called static lift), plus the total of 1) height that a fluid is to be pumped plus 2) friction loss caused by internal pipe roughness or corrosion.
TDH = Static Height + Static Lift + Friction Loss
- Static Lift is the height the water will rise before arriving at the suction side of the pump.
- Static Height is the maximum height reached by the pipe on the discharge side of the pump.
- Friction Loss (or Head Loss) are the losses due to friction in the pipe at a given flow rate.
Variation of differential head Vs flow
This is the primary information reported in the pump performance curves and very important information regarding most of the pump calculations related to differential pressure across the pump. As shown in the sample performance curves, usually 3 curves of differential head Vs. volumetric flow are reported.
Differential head Δh is related to differential pressure ΔP by the equation, ΔP = ρgΔh.
- Curve of differential head for Rated Impeller Diameter represents the variation of differential head with volumetric flow for the impeller with rated diameter which will actually be provided with the pump.
- Variation of differential head with volumetric flow for Maximum Impeller Diameter is plotted for the impeller with the maximum diameter that can be accommodated within the pump. This impeller can be used in case flow through the pump is increased or if more differential head is required in the future, with the same pump.
- Variation of differential head with volumetric flow for Minimum Impeller Diameter is plotted for the impeller with minimum possible diameter. If the flow or differential head requirement is reduced in future, this impeller can be used with lower power consumption.
Although the 3 curves are plotted for a wide range of volumetric flow rates, the actual operation is to be limited within the Maximum and Minimum allowable flow rates as indicated in the sample pump performance curve. Values of the maximum and minimum flow limits are given by the pump manufacturer.
The point on differential head axis (Y-axis) where each of these 3 curves terminates, represents the shut-off differential head for that particular impeller diameter. For normal intended operation, the shut-off differential head for rated impeller diameter is important.
It should be note that the pump curves for differential head Vs. volumetric flow rate are plotted for a particular liquid density. If in the future the process liquid or even just liquid density is changed, that effect has to be considered to finally determine the differential pressure. In such as case, revised volumetric flow should be calculated and located on the pump curve and corresponding differential head should be then determined from the curve for the appropriate impeller diameter. This differential head should then be used along with the changed liquid density to determine the differential pressure across the pump.
Pump Efficiency
As indicated in the sample pump performance curve above, the plot of pump efficiency against volumetric flow rate is also commonly reported on the pump performance curves. When the theoretical pumping power requirement is divided by this efficiency for the corresponding flow, the result is pump shaft power requirement. For more information on pump power calculations using efficiency, refer to EnggCyclopedia's solved sample problem. The calculated pump shaft power has to be provided by an electric motor.
The efficiency curve typically has a maximum within the allowable operating range. This maximum is also known as the Best Efficiency Point (BEP) as indicated in the sample curves. The normal operation should be preferably done close this best efficiency point for minimum power requirements.
Good pump efficiency means that a pump is not wasting energy in order to maintain its performance point. No pump is 100% efficient, however, in the work it has to do to transfer liquids. When selecting a pump and motor combination, consider not only the total current demand but future demand to ensure your selection has the capacity to meet changing requirements. To that end, sizing the pump for performance variables rather than peak efficiency is a common practice.
Sometimes a plot of Pump Shaft Power requirement is also done against the volumetric flow rate on the performance curves. This curve readily gives the value of power requirement for a particular flow rate.
NPSHR (Net Positive Suction Head Required)
Every pump requires certain Net Positive Suction Head (NPSH), for safe and smooth operation and to avoid cavitation in the pumps. NPSHR is the minimum amount of pressure required on the suction side of the pump to avoid cavitation, or the introduction of air into the fluid stream. The pump manufacturer provides these values by plotting them against the volumetric flow. As seen from the sample performance curves, NPSH requirement increases for increase in volumetric flow. When designing a pump system and positioning the pump, it must always be ensured that NPSH Available is higher than the NPSH requirement as per pump curves. For details about calculation NPSH Available, refer to EnggCyclopedia's solved sample problem.
How to read a pump curve
In the simplest words, pump performance curve is a graph of 'differential head' developed by the pump, plotted against the operating flow rate.
When more fluid is pushed through the pump, it is generally going to develop less differential head (given the mechanical and power constraints).
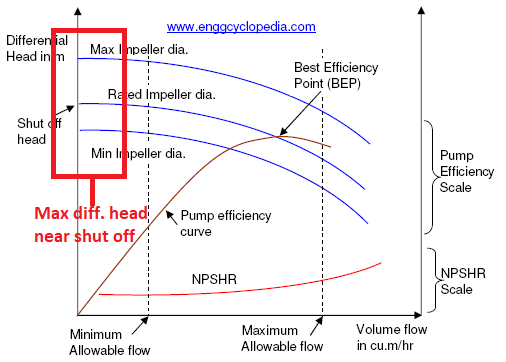
The same can be observed on the pump performance curve. For any given impeller diameter, pump generates the maximum differential pressure or differential head near the shut off point, when there is very little fluid getting pushed through the pump.
As the flow rate is increased, we move to the right of this graph. And you can find that for the same impeller diameter, differential head starts to drop as the flow is increased.
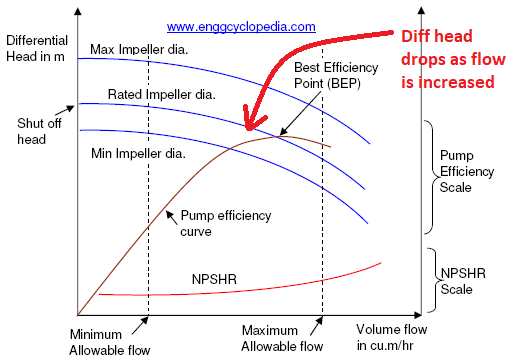
But, even as the diff. head drops down the resulting output given by the pump in terms of flow rate multiplied by differential head goes up because of increasing flow rate. As this happens, the pump also consumes more and more power to push more fluid while trying to maintain similar level of differential pressure (or differential head).
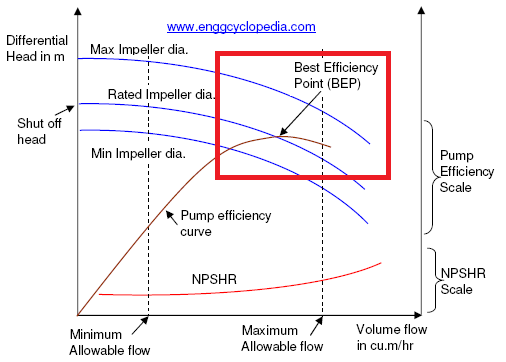
As a result, there is a point of optimal efficiency where the pump can operate at highest ratio of output power / input power. This point is known as the best efficiency point for that pump and clearly visible on 'Pump Efficiency Curve' plotted on the same chart, against operating flow rate.
Values of NPSH required (NPSHr) are also provided by the pump maker, in the form of another graph plotted on the same chart.
Examples of pump curves
Different pump manufacturers have different formats for their pump curves diagram. Therefore, sometimes the pump curves can look a bit confusing at first. Sometimes there will be multiple lines on a single chart and you may not be sure about the meaning of each line. In such cases, always look for the label of each curve.
For example consider the following pump curve chart.
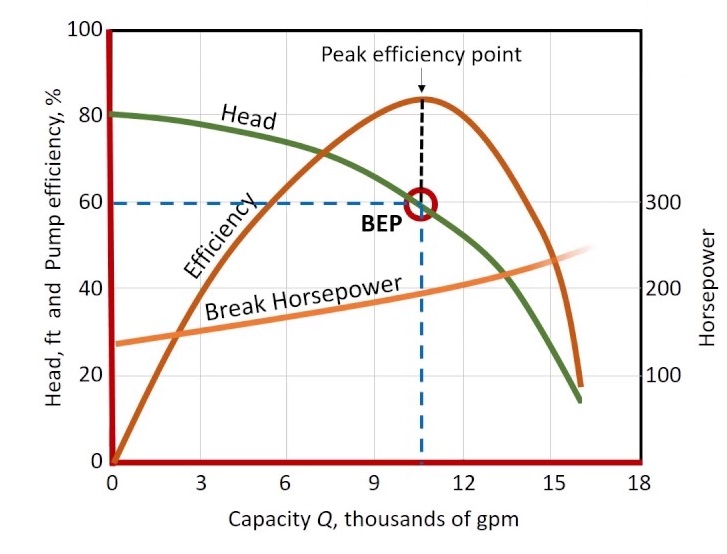
There are multiple curves here, on a single chart. But the good thing is that they are properly labeled. The green curve clearly represents the variation of "head Vs flowrate". The head is maximum at zero flow and drops down as the flow is increased. Notably, the "head vs. flowrate" curve is only plotted for a single impeller size.
Further, there is another U shaped curve of brown color. This represents the variation of pump efficiency against the flowrate. Peak point on the efficiency curve is clearly marked on the chart as the - best efficiency point (BEP).
Finally, there is an orange color curve at the bottom indicating the required NPSH (NPSHr) for different flowrates. As the flowrate increases, so do the frictional losses. Hence at NPSHr goes up with increasing flowrate.
But not all pump curves are so nicely labeled. For example, consider this pump curve chart.
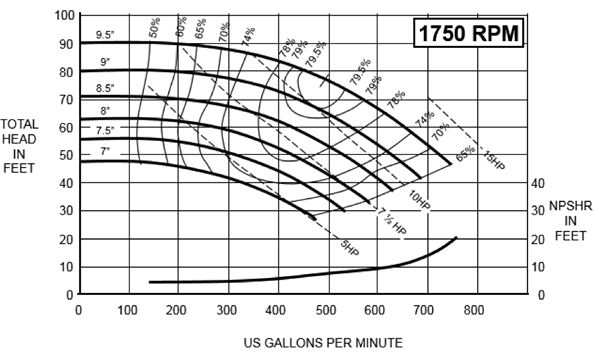
In this case there are multiple curves on the chart and they are not very clearly labeled. But if you have understood different types of pump curves by now, you can easily guess that the multiple parallel curves at the top, represent "head Vs flow". Each of those curves are labeled with different pump impeller diameters in inches - ranging from 7" to 9.5". Clearly, the differential head increases as you use larger pump impellers.
Then you can also see an upward trending curve at the bottom of the chart. That is the "NPSHr vs flowrate" curve.
Notably, there is no separate U shaped efficiency curve on this chart. But, you can still see few contours running across the "head Vs flow" plots. These are the efficiency contours plotted across the "head Vs flow". Each contour is labeled with % efficiency. You can see the maximum value to be close to 80%, at the center of all contours. That center is the best efficiency point (BEP) for this pump curve chart.
Using pump curves in operation
Pump curves are quite useful in the pump selection, testing, operation and maintenance.
- When selecting a pump for a particular process, pump curves are essential as they specify not only the performance characteristics, but also operating flow range, efficiency characteristic, NPSH requirements etc. So the engineer can decide how suitable the pump would be for different operating scenarios.
- When the pump is procured, it has to be tested for the performance promised by the pump maker. Pump curves are used for such pump performance tests.
- During operation of the plant, conditions and process requirements may change considerably. Correspondingly the operating flow rate and differential pressure requirements also changes. Pump curves are then used to find out if the existing pump can be used in the modified operating conditions. If yes, then what would be the limitations.
More about pump performance curves
- Pump performance test - is used for gathering the performance data, then used for plotting the pump curve.
- Cause of pump overloading - explained with the help of pump curves
- Theory and equations for centrifugal pumps
- Operation and maintenance of centrifugal pumps